Regularly updated with new charts and explanations that help make sense of a complex and ever-changing industry. Brought to you by the experts at API. Come back regularly for new content. For questions please contact: press@api.org.
Electric-drive vehicles, including hybrid electric, plug-in hybrid electric, and battery electric vehicles, now account for nearly 22% of U.S. light-duty vehicle sales. Their share of new sales has more than doubled since 2021. The Inflation Reduction Act (IRA) introduced and modified tax credits for the purchase of plug-in hybrid and battery electric vehicles, which will now expire at the end of September 2025. However, while hybrid electric vehicles were not eligible for the same tax incentives, they have led the growth in the electric-drive vehicles’ market share over the past couple of years.
In 2024, EVs consumed 11.7 million megawatt-hours (Mwh) of electricity in the U.S., increasing 55% year-on-year. California had the highest electricity demand for EVs at 3.6 million Mwh, accounting for 31% of all U.S. EV-related electricity demand. While EV electricity demand has been growing rapidly, it still represents a very small portion of overall electricity demand. In 2024, EV-related electricity demand represented only 0.3% of total U.S. electricity sales and 1.5% of electricity sales in California.
According to the Bureau of Labor Statistics (BLS), non-retail oil and natural gas sector employees made an average of $135,000 in 2024, which is 77% higher than the U.S. average annual pay. Within the sector, oil and natural gas extraction workers earned the highest average salary of $215,000.
U.S. LNG has played an increasingly important role in Europe’s energy mix with the U.S. accounting for 27% of the EU’s total natural gas imports in 2Q25, up from 4% in 2019. The U.S. is the largest LNG supplier to the bloc, accounting for 58% of LNG imports in 2Q25. At the same time, Russia’s share of the EU’s natural gas imports fell to 11% in 2Q25, down from 51% in early 2019. Europe has also become the largest destination for U.S. LNG with a record 67% headed to the EU and UK between January and April 2025, up from 37% in early 2019.
Energy Institute data shows consumption levels for all major energy sources reached record levels in 2024, including oil, natural gas, coal, nuclear, hydroelectricity, solar, wind, biofuels, and other renewables. This is the first time this has happened concurrently across all major energy sources since 2006. Oil remains the world’s largest energy source, meeting 34% of global demand. Global energy demand rose by 12 EJ (2%) year-on-year with China and India accounting for nearly 50% of the growth. Meanwhile, natural gas grew the most of the energy sources, accounting for a third of the total increase.
The U.S. accounted for 49% of global natural gas liquids (NGLs) production in 2024 and produced more than four times the amount of the second largest producer, Saudi Arabia. Production in the U.S. has more than doubled since 2015, with the rapid expansion of ethane and propane. NGLs are found in raw natural gas streams and are extracted at processing plants before the natural gas is marketed. Together, ethane and propane represent 72% of U.S. NGL production. Propane is commonly used as a feedstock in petrochemical plants to make plastics or as a fuel for heating or drying. Ethane is primarily used as a petrochemical feedstock. Record production has also helped support rising U.S. exports of propane and ethane.
U.S. net crude oil imports have fallen as domestic crude oil production has grown. Since 2014, the U.S. has produced more crude oil than it has imported on a net basis. Over the past decade, domestic crude oil production has grown by 50% while net crude oil imports have fallen by 65%. Rising domestic production has helped the U.S. become less reliant on imported crude oil, particularly from the Middle East. In 2024, only 8% of U.S. crude oil imports came from Persian Gulf countries, down from 25% in 2014.
The U.S. summer driving season typically spans from April to late-September. More drivers historically hit the road with spring and summer holidays, helping boost domestic gasoline demand. EIA’s preliminary weekly data shows gasoline demand in early July was up ~430 kb/d compared to March’s average demand level. This is slightly more than the seasonal average change for the period (+315 kb/d). The boost has been helped by a record number of people traveling. AAA estimated that a record number of people traveled over Memorial Day and July 4th holidays. 61.6 million people were projected to travel by car over July 4th– the highest volume for any period on record. The U.S. driving season has typically peaked in July or August before slowing in September.
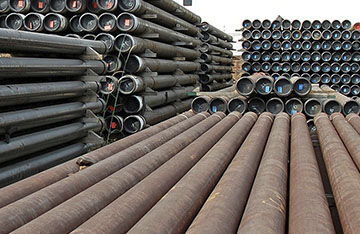
The U.S. oil and natural gas industry uses both domestic and imported steel products in its operations. In 2024, the U.S. oil and natural gas industry imported $4.1 billion of casing, drill, line, and pipe tubing. Most of these imports came from South Korea (24%), Canada (11%), Japan (10%), and Mexico (8%). Many of these products are specialized with few or no domestic substitutes.
The Trans Mountain pipeline expansion added 590 kb/d of crude oil takeaway capacity between Canada’s oil producing fields in Alberta and the Port of Vancouver on the west coast. The expanded pipeline began ramping up in May 2024 and has eased takeaway constraints and opened new export markets. Canada exported nearly 400 kb/d to non-U.S. markets in January-April 2025, up from ~80 kb/d a year ago. Western Canada Select (WCS) crude oil typically sells at a discount to WTI due to quality differences and transportation bottlenecks. In the past 5 years the discount has been as wide as $30/bbl. The discount remains near $10/bbl despite record exports to non-U.S. markets due to crude quality differences.
Free directories listing all of the participants in our certification-related programs.
View All
Request a Quotation.
Get a Quote
ICP provides the petroleum and petrochemical industries with an independent and unbiased way to evaluate the knowledge and experience of technical and inspection personnel.
Products with the Monogram mark meet API quality, interchangeability, and reliability standards. APIQR registered organizations demonstrate that they operate in conformance with an internationally recognized management system standard(s).
Access standards, analyze available standards, support your organization with other API initiatives and mitigate risk with the latest change management tools like new standards alerts through this direct licensing platform.